
A Placemaking Journal
Why Placemaking Matters: What’s in it for me?
 When a mayoral candidate from my city wrote me to ask me to repeat in writing what I’d said the night before, I realize I need to de-wonk and make my elevator speech more memorable. Why does city planning matter to people who aren’t urban designer types? If I could take an extra five minutes of your time, I’m interested in hearing each of your pitches, in the comments below. Here’s mine, thanks in part to countless conversations with many of you:
For the last 75 years, we’ve been engaged in a Ponzi scheme of paying for the far-flung suburbs with money generated downtown, in compact neighborhoods, and from other levels of government. These sprawling bedroom communities, strip malls, and big boxes arranged in patterns where everyone needs a car are providing a negative return on investment. The roads, water, and sewer cost almost double for these dispersed places, while the return to city and private coffers pale in comparison. Compact neighborhoods return at least 10x more revenue per acre to the City, and often 1,000x more income per acre. At a time when about half of our population doesn’t drive – because they’re too young, too old, too poor, or just choose not to – isn’t it about time that we change our zoning laws to make the sorts of places that will stop bankrupting our cities?
Would that candidate at the party the other night want to pour themselves a double? Or is it de-wonked? My fellow placemaker, Scott Doyon, has a much shorter version:
If an 8 year old can safely get somewhere to buy a Popsicle, and then make it home before it melts, that’s the measure of a livable neighborhood. That’s the Popsicle test.
Dewonking may be a lifelong process for me. The Cluetrain Manefesto calls wonk-speak “techno-latin,” which has a lot of similarities to the blanks in Scrabble: can be used anywhere to mean anything, but has no value. We don’t need more information, we need understanding. And that understanding comes by sharing stories.
Here’s an update from my wonky side of why placemaking matters, which maybe you’ll find useful as you string together your own stories about what matters and why, and how we can make a difference. You’ve seen a similar list from me before, and I’d be grateful if you’d fill in the blanks on what I’m missing.
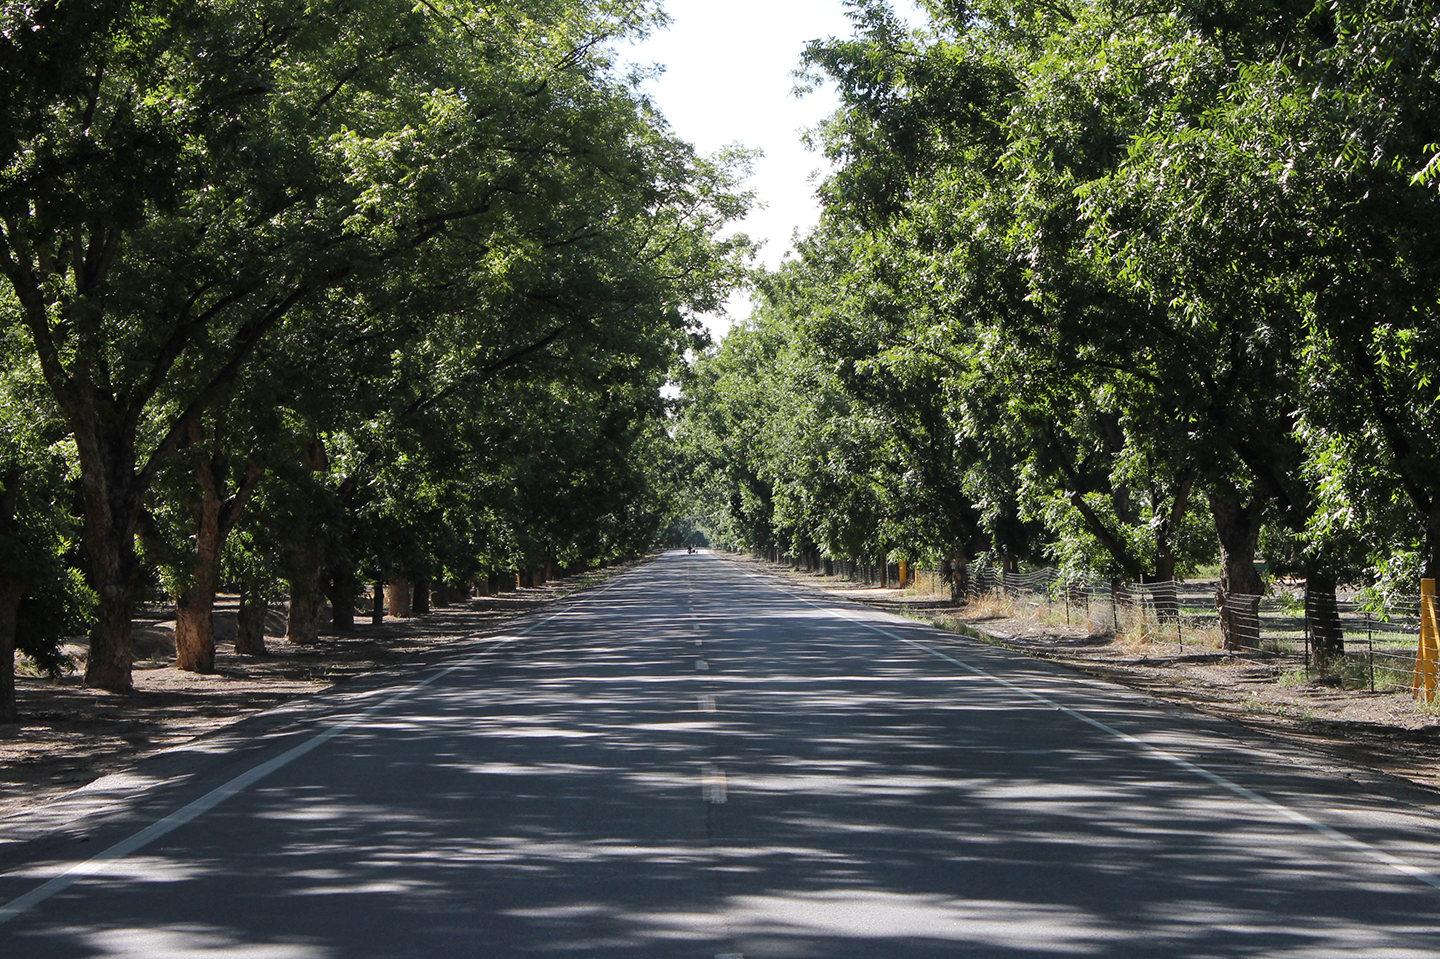
Highway 28, Doña Ana County, NM. Image © PlaceMakers & Andrew von Maur.
The Real Option Theory of Land Development
Urban design should take into account the real option theory of land development. Generally in finance, beta is the volatility of an asset in comparison to the market. As beta decreases, the required rate of return also decreases, because people don’t need to be paid so handsomely if they aren’t taking as much non-diversifiable risk.
However, neither governments nor bankers invest based on levels of urban risk and return, partly because they are only recently being quantified. Take for instance our investments in infrastructure over the last 60 years, where wide, fast roads were assumed to be high return investments.
Instead, they have failed to pay for themselves, leaving us with an estimated $2.2 trillion of infrastructure repairs needed to get above our current grade of a “D,” last time American Society of Civil Engineers checked.
Looking at ROI on transportation investment, the more walkable the place, the greater return. And yet with generally lower risk over time. To correct this misalignment, bankers are beginning to consider how to retool deeply homogeneous bundled mortgages into the new world of mixed-use projects that generate the highest levels of walkability.
Certain federal programs are doing a great job of aligning risk and return in local planning practices, including the HUD-DOT-EPA Partnership for Sustainable Communities. We can’t justify spending any government money unless there are long-term returns that are in line with and actualize the collective local community vision.
So how will zoning reform and urban design spark local economies? By allowing walkable, compact, mixed-use, resilient development, at the scale of the lot, block, neighborhood, and region.
Changing the law to allow urbanism by right makes walkable communities go “in the money” for several reasons, including decreased uncertainty, shortened planning and approval processes, increased flexibility, and increased long term asset value.
Just as homogeneous development patterns of housing, strip mall, or big box monocultures didn’t pay off, economic diversity is essential in post-recessionary times. Remembering that beta is non-diversifiable risk, keeping local economies diverse while in keeping with local character is essential for resilience.
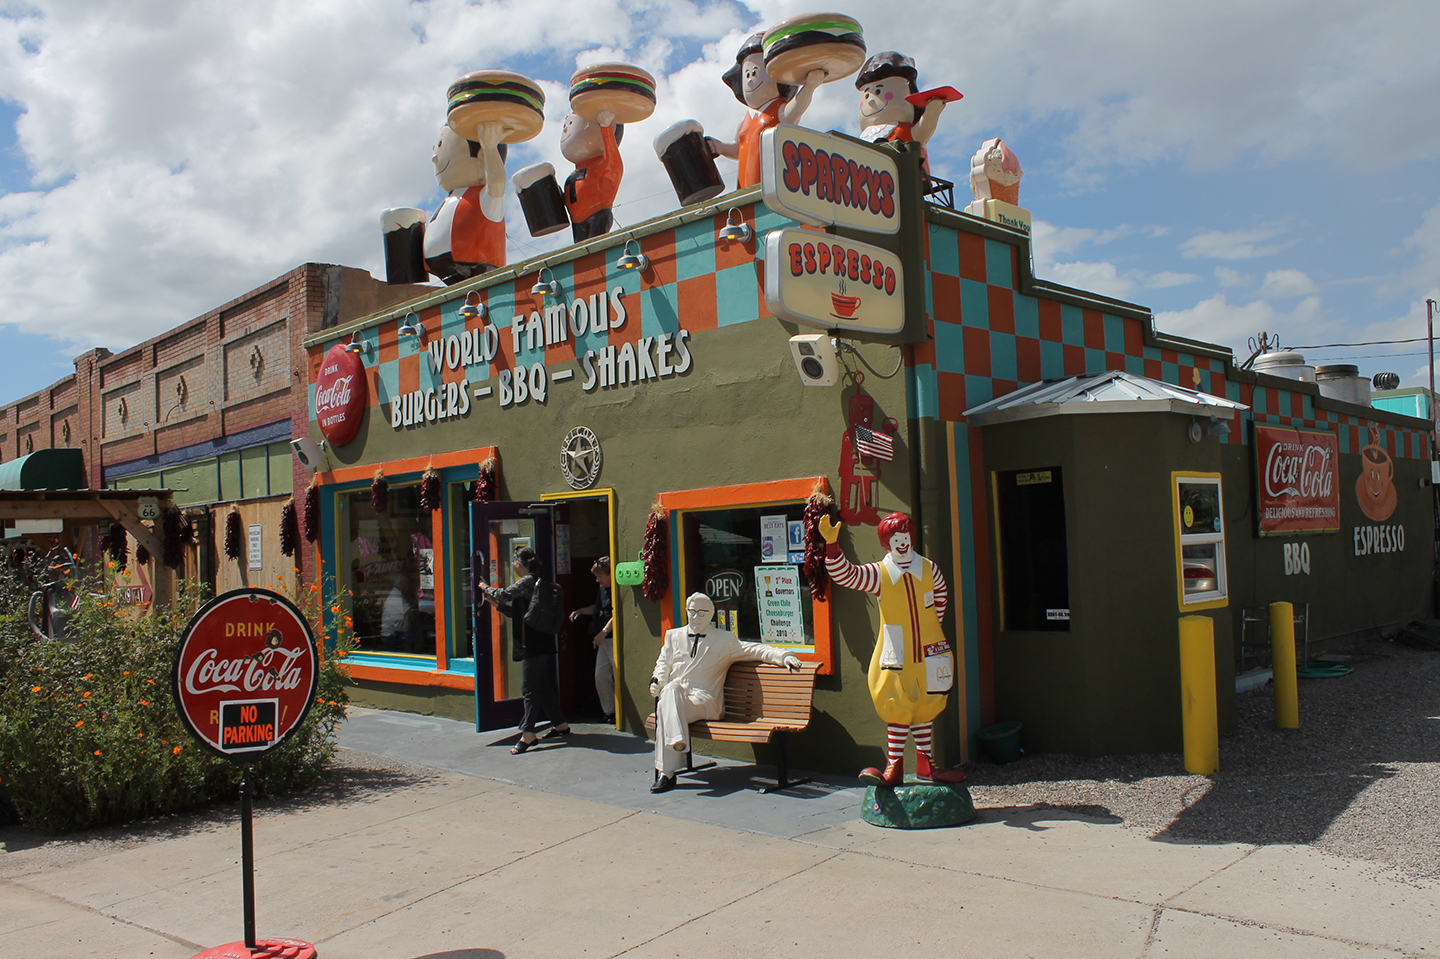
Hatch, NM. Image © PlaceMakers & Andrew von Maur.
Quantifying the Value of Walkable Places
Many studies quantify the value of the sorts of livable, walkable places that a form-based code and similar zoning reforms generate. Here is a selection of studies that help make the case for walkability.
Building Equity: Commercial and Home Values
Walkable urban office space in the 30 largest metros commands a 74% rent-per-square-foot premium over rents in drivable suburban areas. (Foot Traffic Ahead, George Washington University School of Business, 2014)
GPD per capita in walkable urban metros is 38% higher than the average GDP per capita in the 10 low-ranked walkable urban metros. (Foot Traffic Ahead, George Washington University School of Business, 2014)
In metro D.C., each step up the walkability ladder adds $9 per square foot to annual office rents, $7 per square foot to retail rents, over $300 per month to apartment rents, and nearly $82 per square foot to home values. (Brookings Institution, 2012)
Property values within walking distance of public transit stations are 40% higher than other properties in the same region. (American Public Transportation Association, 2013)
In NYC, 172% increase in retail sales at locally-based businesses on Pearl Street in Brooklyn after a pedestrian plaza was constructed. In Union Square North, commercial vacancies fell 49% after a protected bicycle lane was installed (NYCDOT, 2012).
Homes in walkable urban neighborhoods have experienced less than half the average decline in price from the housing peak in the mid-2000s. (Brookings Institution, 2011)
A 10-point increase in Walk Score increases commercial property values by 5% to 8%. (University of Arizona & Indiana University, 2010)
A one-point increase in Walk Score (based on number of destinations within a short distance) is associated with between a $700 and $3,000 increase in home values. (CEOs for Cities, 2009)
A 5 to 10 MPH reduction in traffic speeds increased adjacent residential property values by roughly 20% nationally in the US. Traffic calming reduced volumes on residential streets by several hundred cars per day and increased home values by an average of 18%. (Local Government Commission, 2000)
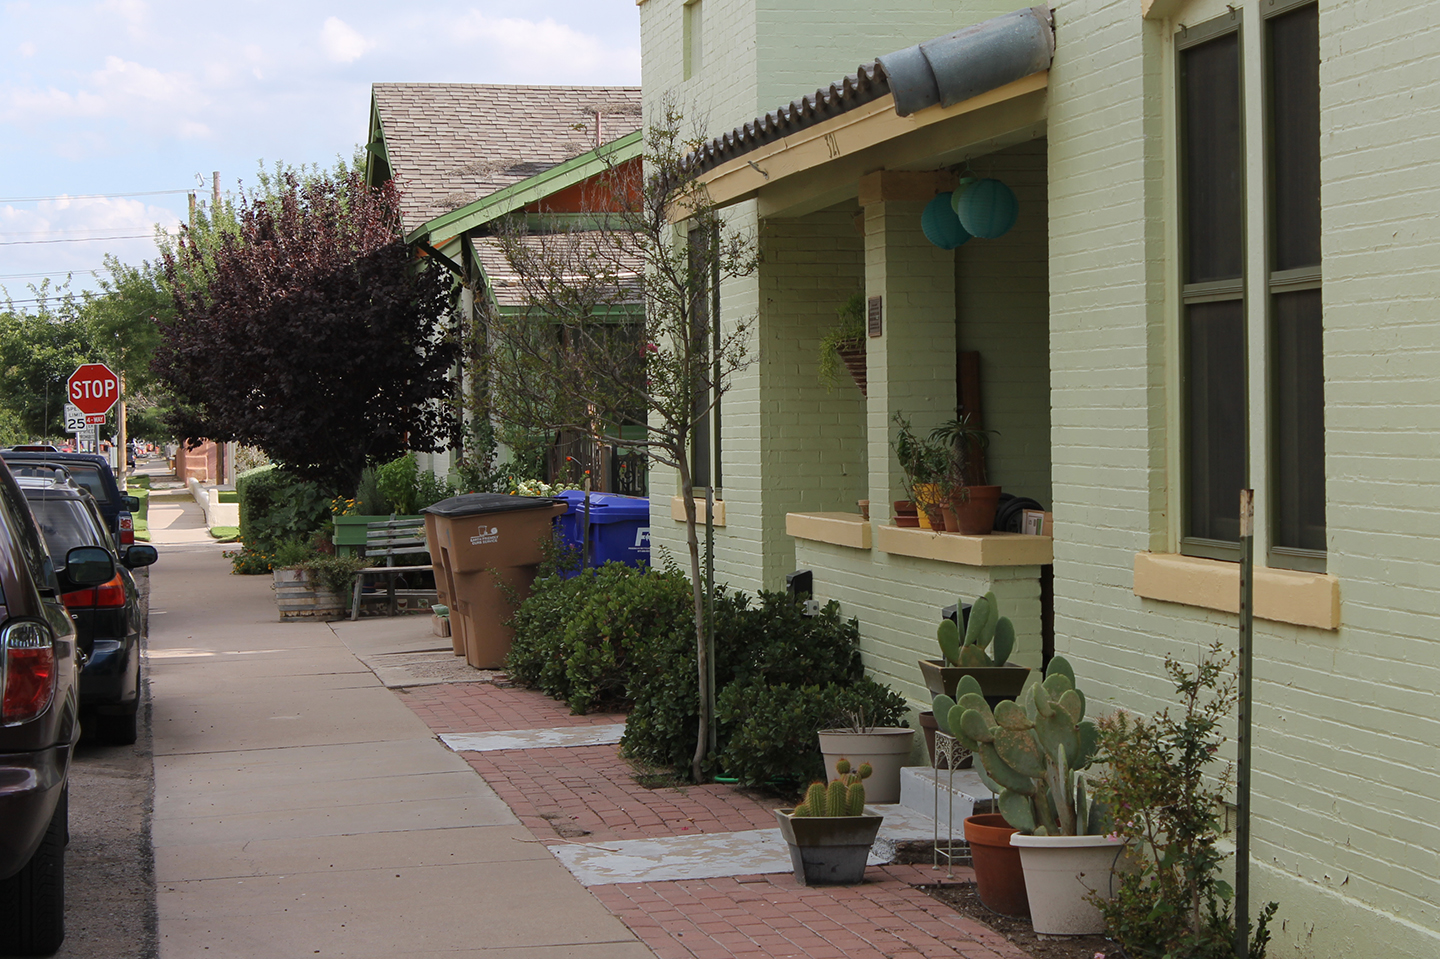
Alameda, Las Cruces, NM. Image © PlaceMakers & Andrew von Maur.
Building City Coffers: Increased Tax Base and Decreased Cost
The most walkable urban metro areas have substantially higher GDP per capita and percentages of college graduates over 25 years of age in the population. (Foot Traffic Ahead, George Washington University School of Business, 2014)
Emotional connection to community = highest rates of GDP growth. (Soul of the Community, Knight Foundation & Gallup, 2011)
Salt Lake City’s Modeled Growth Strategy estimates compact neighborhood development to save $4.5 billion over 20 years in transportation, water, sewer, and utility infrastructure. (Salt Lake City Modeled Growth Strategy, 2013)
Compact infrastructure is up to 47% less expensive per household than conventional development patterns. (EPA; Morris Beacon, 2010)
Urban mixed-use mid-rise is 25 to 59 times more revenue per acre than its suburban counterparts (PlaceMakers on Woodstock, GA, 2012; Minnicozzi on Sarasota, FL, 2011)
Calgary estimated compact development would save the City $11 billion in infrastructure costs, making it 33% less costly to build the roads, transit, water, recreation, fire, and schools that it expects to need over the next 60 years. (PlanIt Calgary, 2009)
Smart growth development generates 10 times more tax revenue per acre on average than conventional suburban development. (Building Better Budgets, Smart Growth America, May 2013)
The City of Nashville’s non-downtown 30+ form-based codes in areas including suburban greenfields experienced property values up 3.5x faster than region. (City of Nashville, 2013)
Downtown Nashville adopted the new code in Feb 2010. Analysis of the 30 months preceding the rezoning and the 30 months after (with an equal amount of recession time in both) show that property values went up 209%, not adjusting for the bubble. One downtown development, The Gulch, generated 1,150 times more income per acre to the city than its average suburban counterpart. (Building Better Budgets, Smart Growth America, 2013)
Las Cruces, New Mexico. Image © PlaceMakers
Building Health: Cycling and Walking
The total costs of obesity in the US for 2013 is estimated at $305 billion. (National Center for Weight & Wellness, George Washington University, 2014)
Walkscore’s Bikescore offers up some strong reasons to cycle: “$10 saved for each 10 mile commute. One pound CO2 saved for every mile pedaled. 30 minutes per day of riding cuts odds of stroke and heart disease by 50%.” (Walkscore, 2012)
Forbes’ Pedaling to Prosperity lays out the ways that biking saves U.S. riders billions a year. Average annual operating cost of a bicycle: $308. Average annual operating cost of a car: $8,220. Between 2000 and 2010, the number of bicycle commuters grew 40% in the US. The average American household spends more on transportation (16%) than on food or healthcare. Low-income families may spend up to 55% of income on transportation when they live in auto-centric environments. (Forbes, 2012)
Copenhagen’s Bike Account values one mile on a bike as a $.42 economic gain to society, one mile driving is a $.20 loss. (Grist, 2012)
2014 Benchmarking Report for Bicycling and Walking in the United States:
– Communities that invest in bicycling and walking have higher property values, create new jobs, and attract tourists.
– States with higher rates of bicycling and walking to work also have a higher percentage of the population meeting recommended levels of physical activity, and have lower rates of obesity, high blood pressure, and diabetes.
– While biking and walking comprise 11% of all US trips and 15% of fatalities, facilities get 2% of US federal transportation funds.
– Between 1980 and 2011, the number of pedestrians killed on U.S. roadways decreased 45%, and cyclist fatalities was down 30%.
– Cities with more people walking and cycling have the lowest fatality rates for pedestrians and bikers.
As a result of these cycling trends, Bicycle-Friendly Business Districts (BFBDs) are popping up. (Transportation Issues Daily, 2012)
Regular walking increases memory (hippocampus size) and decreases risk of dementia by 50%. (National Academy of Sciences, 2011)
Risks of death from breast and uterine cancer were reduced 19% in those who walked 1 to 3 hours per week, by 54% for walking 3 to 5 hours/week. (Harvard University Women’s Health Study, 2012)
Retired men who walked less than 1 mile/day had nearly twice the mortality rates of those who walked more than 2 miles/day. (Harvard University, Brigham & Women’s Hospital, ongoing)
Among the more than 72,000 women in the Nurses’ Health Study, those who walked 3 or more hours/week reduced their risk of a coronary event by 35% compared with women who did not walk. (JAMA, 2000)
If one in ten Massachusetts adults started a regular walking program, the state would save $121 million in heart disease expenditures annually. (MA Dept. of Public Health, 2008)
Men and women age 50–71 who took a brisk walk nearly every day had a 27% reduced death rate compared to non-exercisers. Adding 20 minutes of vigorous exercise 3 days a week resulted in a 32% reduced death rate. Combining vigorous exercise and walking each week produced 50% reduced mortality. (Arch Internal Medicine, 2007)
Obesity costs the average US taxpayer $180 per year, even if they’re healthy. If 1 in 10 adults started a regular walking program, the US saves $5.6 billion, which adds up to the college tuition for 1,020,000 students. (National Governors Association, 2006)
A study of over 3,200 overweight adults found that a good diet and walking 2.5 hours/week reduced their risk of developing diabetes by 58%. Participants aged 60 and older reduced their risk by 71%. (New England Journal of Medicine, 2002)
Sedentary men who began exercising after the age of 45 have a 24% lower death rate than those who remain inactive. On average, sedentary people who became active later in life improved their life expectancy by about 1.6 years. (Harvard Alumni Study, 2000)
The average white male living in a compact community weighs 10 pounds less than his counterpart in a low-density subdivision. (British Columbia School of Planning)
Every 1% rise in the urban sprawl index correlates with a 0.5% increase in the risk of obesity. (Boston University School of Public Health)
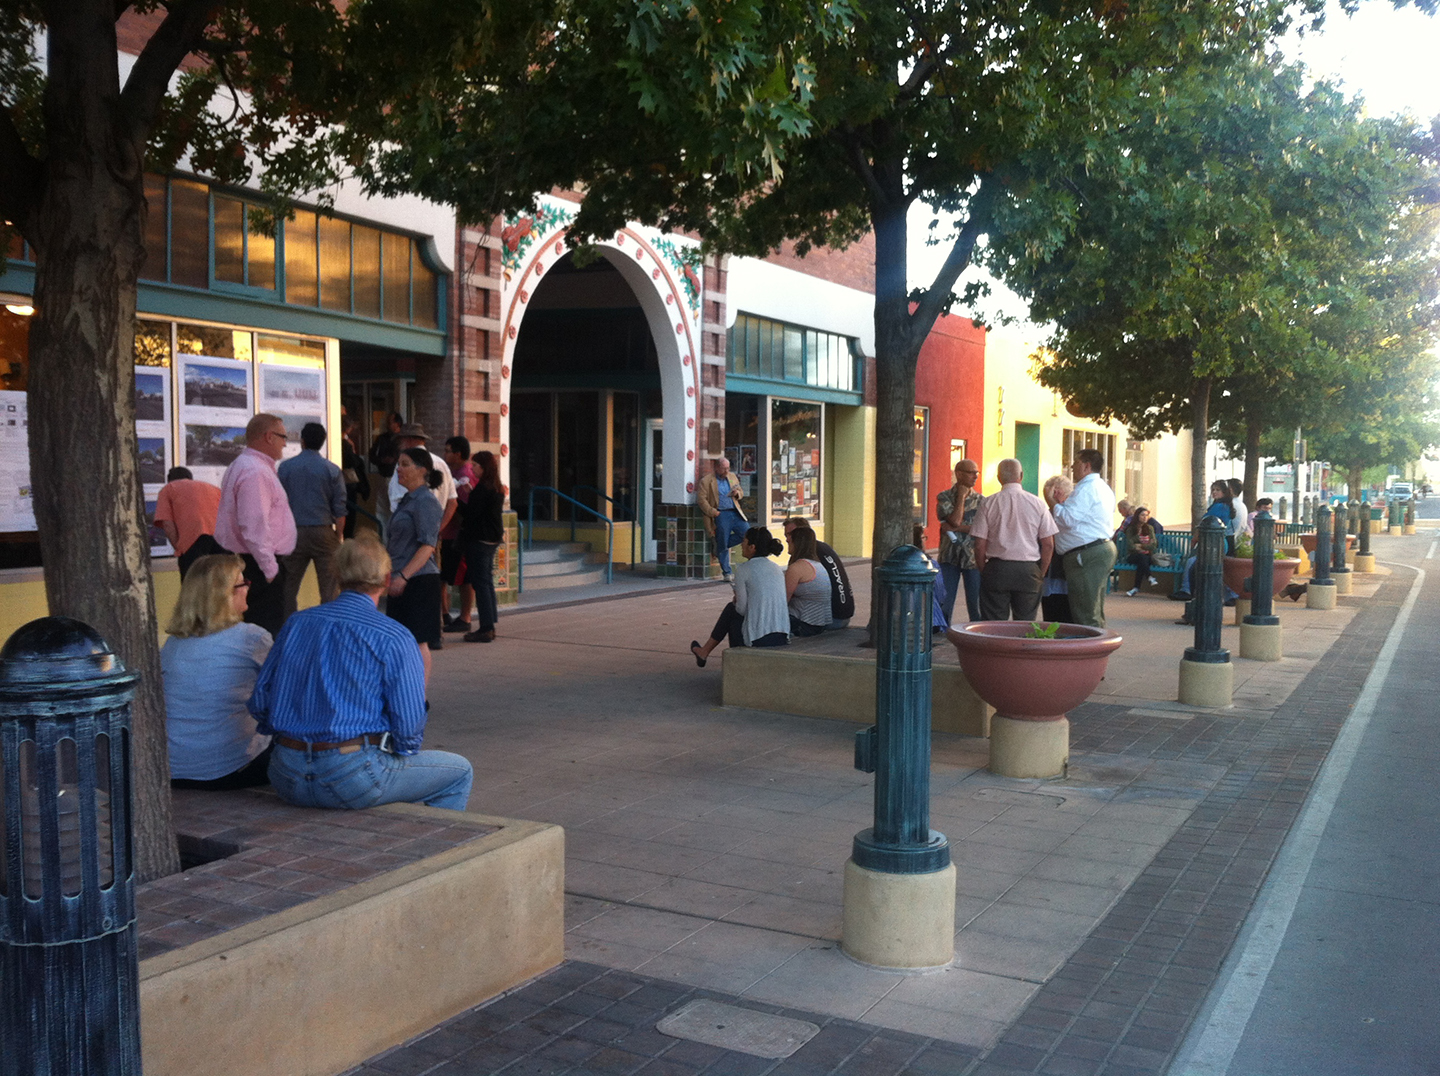
Mesilla, Las Cruces, NM. Image © PlaceMakers & Andrew von Maur.
Building Connections: Social Capital
People living in walkable neighborhoods trust neighbors more, participate in community projects and volunteer more than in non-walkable areas. (University of New Hampshire, 2010)
Building Supply: Market Preference
Fewer young people want cars. In 1995, people age 21 to 30 drove 21% of all miles driven in the U.S.; in 2009 it was 14%, despite consistent growth of the age group. Living car-free in walkable areas fits younger lifestyles. (Advertising Age, 2010)
Decreasing Emissions: VMT and Gas Pump Bills
Households in drivable suburban neighborhoods spend on average 24% of their income on transportation; those in walkable neighborhoods spend about 12%. The difference amounts to $700 billion a year in total, according to Scott Bernstein of the Center for Neighborhood Technology. Paying for one less car allows a family to afford a $100,000 larger mortgage. (Brookings, 2010)
The biggest difference between spenders and savers is car expenses. (Statistics Canada, 2005)
Walkable communities can quell the effects of global warming and peaking oil with mixed-use, compact urban design. An average family in an auto-dependent community drives 24,000 miles per year, while a family in a walkable community of 16 dwelling units per acre and compact mixed-use drives 9,000 miles per year. (Sustainable Urbanism, 2007)
Sustainable urbanism strategy changes energy demand, efficiency and generation. Eco-Districts decrease demand via transit-rich compact development patterns, increase efficiency with high performance infrastructure and green architecture, and increase generation with renewable energy sources, on-site generation, district energy, and integrated agriculture.
While the average person in North America still spends 6.25 weeks every year in their car, we’re starting to resist what that means to our wallet with rising fuel prices, and to our lifespans with rising obesity. We’re starting to redefine livability in terms of quality of life (community amenities, active transportation, family time, social capital) instead of standard of living (size of house, number of cars, size of lot, earnings).

If PlaceShakers is our soapbox, our Facebook page is where we step down, grab a drink and enjoy a little conversation. Looking for a heads-up on the latest community-building news and perspective from around the web? Click through and “Like” us and we’ll keep you in the loop.
