
A Placemaking Journal
Places that Pay: Benefits of placemaking v2

“Reconciliation is making peace with reality, our ideals, and the gap in between,” via Her Honour, Janice C. Filmon, Lieutenant Governor of Manitoba. Much of our work here at PlaceMakers is about redirecting the trajectory of where we are headed with the targets needed to ensure the wellness of our environment, equity, and economy, so that stopgap measures are kept to a minimum. The studies that quantify how the form of our cities, towns, villages, and hamlets effects this wellness is essential to building the political will to make change. Listed below are the 65 key works I’m most likely to quote, to make the case for developing the city and town planning tools we need to make a difference for the resilience of people, planet and profit.
ECONOMY
Building Supply: Market Preference
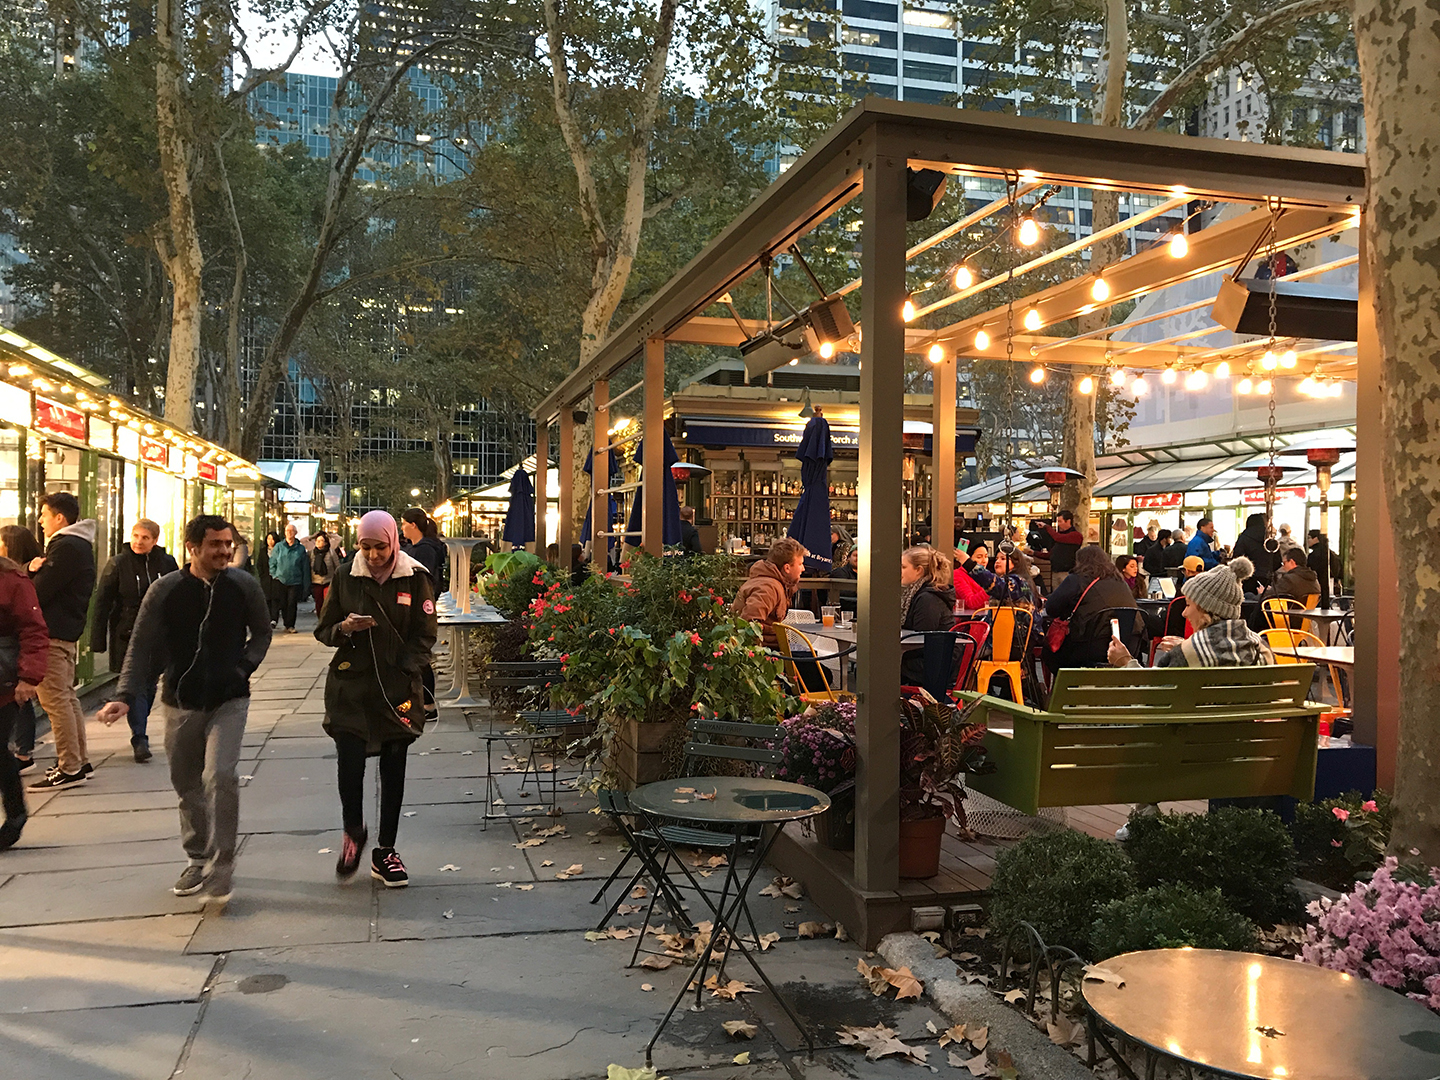
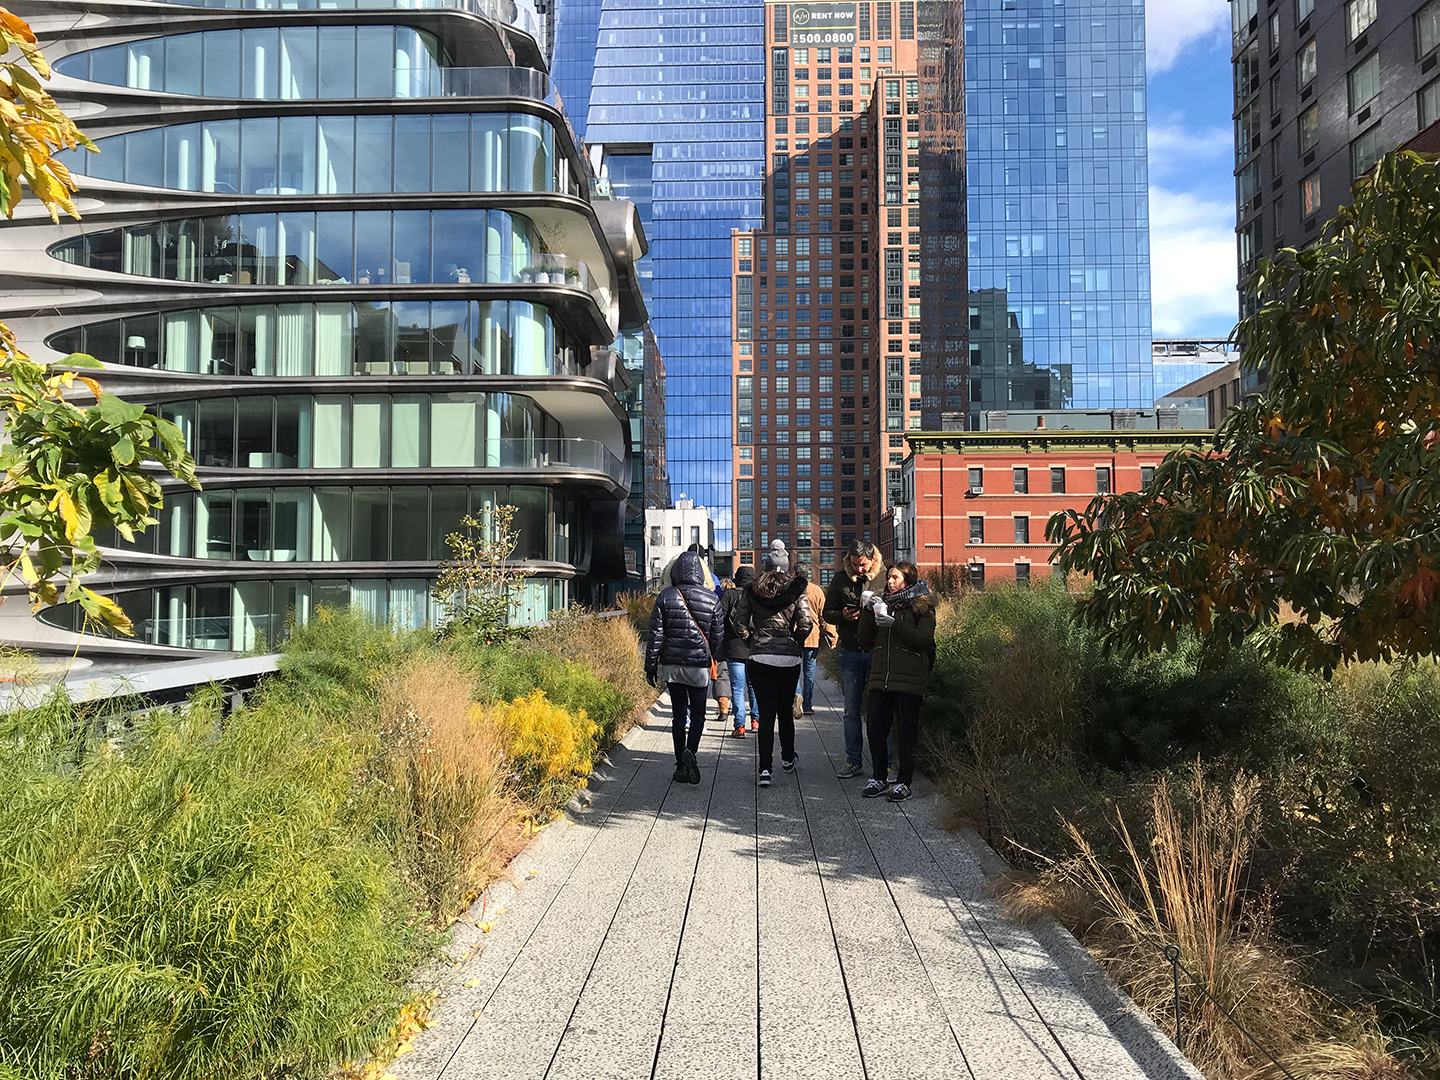
Companies are gravitating to walkable downtown neighborhoods, from the very small to the Fortune 500. These moves include relocations, consolidations, and expansions to places with considerably higher Walk Scores, Transit Scores, and Bike Scores from where the businesses were previously located. Companies are making their move downtown to attract and retain talented workers, to build brand identity and company culture, to support creative collaboration, to be closer to customers and business partners, to centralize operations, and to support the triple bottom line. (Smart Growth America; Cushman & Wakefield; George Washington University School of Business Center for Real Estate and Urban Analysis, 2015)
66% of Americans believe that investing in schools, transportation choice, walkability, and key community features is the best way to strengthen the economy. Less than 10% of the massive Millennial and Boomer Generations want traditional, auto-dependent suburban living, even though over 40% live there today. “Economics of place” is likely to drive economic growth and development, with traditional business recruitment strategies seen as less important than investing in local amenities and quality of life. (American Planning Association, 2014)
Americans prefer walkable communities more so than they have in the past. 79% place importance on being within easy walking distance of neighborhood destinations. (National Association of Realtors, 2015)
National retailers pay attention to Walk Score, often requiring a score of 80 or higher to consider adding a new store downtown. However, in the 51 largest U.S. metro areas, only 12% of neighborhoods are walkable, which is down from 19% in 1970. The 50/50/50 rule says that Main Street retail’s ideal sweet spot enjoys at least 50,000 people earning at least $50,000 per year, or 50,000 cars going by a store. (Gibbs, Bob, 2011)
Trying to build a downtown out of just specialty shops does not work because form follows anchor. Only about 30,000 square feet of retail is supportable without an anchor. An anchor may be a baby box retailer as well as non-retail amenities. A library, post office, and courthouse are all strong civic anchors. In most places, the anchor pays half the rent of in-line stores, in exchange for their big advertisements and draw. (Gibbs, Bob, 2011)
The rising Millennial generation coupled with the retiring Baby Boomers make up half of the U.S. population, and are driving the demand for a walkable urban alternative in downtowns. Across North America, downtown residents are frequently younger and better educated, and being close to work and public transit are their top two reasons for living downtown. (Smart Prosperity Institute, 2013)
This trend toward more new jobs in city centers, with employment growth shrinking in the suburbs, has built up momentum in the last several years. Businesses are choosing to locate in walkable locations, to attract younger workers who prefer a less car-dependent, more urban lifestyle. (Cortright, Joe; City Observatory, 2015)
Property values within walking distance of public transit stations are 40% higher than other properties in the same region. (American Public Transportation Association, 2013)
Old ideas can sometimes use new buildings. New ideas must use old buildings.” ~Jane Jacobs
Building City Coffers: Increased Tax Base and Decreased Costs
Smart growth development in the U.S. generates 10x more tax revenue per acre than conventional suburban development and costs less by an average of 10% on ongoing delivery of police, ambulance and fire services; Income per acre is as high as 1,150 times more under Nashville’s downtown form-based code, compared to suburban counterparts. (Smart Growth America, 2013)
While suburbs are growing 160% faster than cities in Canada, suburban dwellers pay only half the cost of roads that city dwellers pay. (Smart Prosperity Institute, 2013)
Urban mixed-use mid-rise is 25 to 59 times more revenue per acre than its suburban counterparts. (Minicozzi, Joe; Urban3, 2010)
London, Ontario estimates sprawling development patterns will cost an extra $2.7 billion in capital expenditures plus $1.7 billion in operating expenses over compact growth, or $4.4 billion extra over 50 years. (City of London, Ontario, 2013)
Calgary estimated compact development will save the City $11 billion in infrastructure costs, making it 33% less costly to build the roads, transit, water, recreation, fire, and schools that it expects to need over the next 60 years. (City of Calgary, 2009)
Halifax’s annual cost per household is more than two times more per suburban households than for urban. (Halifax Regional Municipality, Nova Scotia, 2005)
Emotional connection to community equals highest rates of GDP growth. (Knight Foundation & Gallup, 2011)
An EPA-sponsored study indicates compact infrastructure is up to 47% less expensive than conventional development patterns. (Ford, Jonathan; Morris Beacon, 2010)
Nashville is the first city with over $1 billion of new construction under form-based codes; for that new development, the property values grew at 3.5 time that of the region from 2005 to 2013. (Bernhardt, Richard, 2013)
Building Commercial and Home Values
If your Walk Score increases from 60 to 80, that increased walkability translates into a $100,000 home price premium. (Redfin, 2016)
A 10-point increase in Walk Score increases commercial property values by 5% to 8%. (Pivo, Gary; Fisher, Jeffrey; University of Arizona; Indiana University, 2010)
A one-point increase in Walk Score (based on number of destinations within a short distance) is associated with between a $700 and $3,000 increase in home values. (Cortright, Joe; Impresa, Inc.; CEOs for Cities, 2009)
Over time in D.C. metropolitan neighborhoods, each step up the walkability ladder adds $9 per square foot to annual office rents, $7 per square foot to retail rents, over $300 per month to apartment rents, and nearly $82 per square foot to home values. (Leinberger, Chris; Alfonzo, Mariela; Brookings, 2012)
Homes in walkable urban neighborhoods have experienced less than half the average decline in price from the housing peak in the mid-2000s. (Brookings, 2010)
The best way to plan for downtown is to see how people use it today; to look for its strengths and to exploit and reinforce them.” ~Jane Jacobs
Building Wealth: Cycling and Walking
One mile on a bike is a $.42 economic gain to society in Copenhagen, while one mile driving is a $.20 loss. (City of Copenhagen, 2012)
Biking saves U.S. riders billions a year. Average annual operating cost of a bicycle: $308. Average annual operating cost of a car: $8,220. Between 2000 and 2010, the number of bicycle commuters grew 40% in the US. The average American household spends more on transportation (16%) than on food or healthcare. Low-income families may spend up to 55% of income on transportation when they live in auto-centric environments. (Forbes, 2012)
The biggest difference between spenders and savers is car expenses. (Chawla, Raj; Wannell, Ted; Statistics Canada, 2005)
Eliminating one car from a typical household budget can allow that family to afford a $100,000 larger mortgage. (Doherty, Patrick; Leinberger; Christopher; Brookings, 2010)
$10 saved for each 10 mile commute. (Mr. Money Mustache, 2011)
Building Wealth: Nature
Proximity to green space is a significant monetary value for both retail and residential uses, with increases of up to one-fifth the value of the property. (Nicholls, S.; Crompton, J. L.; National Recreation and Parks Association; Journal of Leisure Research, 2005)
Street trees contribute to wellness, and have about $90k of direct benefit for each tree, over its lifespan, making the return on investment of a tree about 150x. (Dan Burden, 2006)
Costs of Illnesses: Obesity and Overweight
Almost 30% of people globally are obese, expected to top 50% by 2050. The healthcare cost to treat obesity globally is expected to top $1.2 trillion annually by 2050, 46% of which will fall on the U.S. In 2014, the U.S. spent $324 billion to treat illnesses related to being overweight. (Hay, Simon et al; The Lancet, Volume 390, Issue 10100, 1260 – 1344, 2017)
ENVIRONMENT
Decreasing Emissions: Land Development Patterns
One pound CO2 saved for every mile pedaled on a bike-share bike. (Shaheen, Susan, 2014)
Land development patterns and vehicle miles traveled (VMT) have a significant impact on petroleum use and greenhouse gas (GHG) emissions. Doubling residential density while increasing nearby employment, transit, and mixed use can decrease VMT by 25%, along with reductions in energy consumption and GHGs. (The Transportation Research Board; National Academy of Sciences, Engineering, and Medicine, 2010)
New Yorkers emit far less carbon (5.8 metric tons of CO2 per capita in 2014) than those of residents of comparable U.S. cities and about a third as much carbon as the activities of the average American (16.5 metric tons of CO2 per capita in 2014). (New York City, 2016)
Walkable communities can quell the effects of global warming and peaking oil with mixed use, compact urban design. An average family in auto-dependent community drives 24,000 miles per year, while a family in a walkable community of 16 dwelling units per acre and compact mixed use drives 9,000 miles per year. (Doug Farr, 2007)
Households in drivable suburban neighborhoods spend on average 24% of their income on transportation; those in walkable neighborhoods spend about 12%. The difference amounts to $700 billion a year in total, according to Scott Bernstein of the Center for Neighborhood Technology. (Bernstein, Scott; Center for Neighborhood Technology, 2015)
41 million acres of rural land the US lost to development from 1982 to 2007. That’s almost the size of the State of Washington. We are developing real lands at a rate of 40 acres per hour. (American Farmland Trust, 2017)

EQUITY
Building Connections: Social Capital
People living in walkable neighborhoods trust neighbors more, participate in community projects and volunteer more than in non-walkable areas. (Rogers, Shannon; Halstead, John; Gardner, Kevin; Carlson, Cynthia; University of New Hampshire, 2010)
Social equity is a generator of social capital. Which in turn builds more equity. Every ten minutes of commuting reduces all forms of social capital by 10%. (Putnam, Robert, 2000)
Building Health: Cycling and Walking
Communities that invest in bicycling and walking have higher property values, create new jobs, and attract tourists. More jobs are created per dollar spent on pedestrian and cycling amenities than on car-only investments. States with higher rates of bicycling and walking to work also have a higher percentage of the population meeting recommended levels of physical activity, and have lower rates of obesity, high blood pressure, and diabetes. Cycling and walking investments return up to $11.80 for every $1 invested. (The Alliance for Biking & Walking, 2016)
Cycling to school decreases kids’ chance of being overweight or obese. (Ostergaard, AG et al; Journal of Physical Activity and Health, Volume 9, 2012)
Among the more than 72,000 women in the Nurses’ Health Study, those who walked 3 or more hours/week reduced their risk of a coronary event by 35% compared with women who did not walk. Risks of death from breast and uterine cancer were reduced 19% in those who walked 1 to 3 hours per week, by 54% for walking 3 to 5 hours per week. (Harvard University, 2012)
Women who cycle for transportation were 35% less likely to die during the follow-up period. (Matthews, CE; Jurj, AL; Shu, XO; Li, HL; Yang, G; Li, Q; Gao, YT; Zheng, W; American Journal of Epidemiology, 165, 1343-50, 2007)
Commuters are more satisfied with cycling than driving or taking transit, even in Canadian winter. (Willis, D., Manaugh; K., El-Geneidy, A., 2013)
While the number of overweight kids is starting to plateau in developed countries, the number worldwide have increased by a factor of 10 in the last 40 years. 124 million boys and girls are obese. (Abarca-Gomez, Leandra et al; World Health Organization; The Imperial College in London, 2017)
Regular cycling is correlated to a 50% less heart disease, observing people who cycle 20 miles a week compared to those who do not exercise at all. (Purdue University, 2017)
People who cycle to work were 40% less likely to die during the follow-up period. (Andersen, L et al; Archives of Internal Medicine, 160, 1621-28, 2000)
Regular walking increases memory (hippocampus size) and decreases risk of dementia. Exercise training increased hippocampal volume by 2%, effectively reversing age-related loss in volume by 1 to 2 years. (Erickson, Kirk et al; University of Pittsburgh, 2011)
Combining vigorous exercise and walking each week produced a 50% reduced mortality. (Kokkinos, Peter, 2012)
The average white male living in a compact community weighs 10 pounds less than his counterpart in a low density subdivision. (Frank, Lawrence; British Columbia School of Planning, 2007)
Every 1% rise in the urban sprawl index increases the risk of obesity by 0.5%. (Lopez, Russ; Boston University School of Public Health, 2003)
The medical costs to treat obesity in the US for 2008 is estimated at $147 billion. (Center for Disease Control; RTI, 2009)
Building Health: Nature
Sound scientific evidence confirms that parks contribute to human and social wellbeing via 1) biodiversity (as measured through species richness); 2) property prices; 3) physical activity and reduced obesity; and 4) local cooling. (Konijnendijk, Cecil; Annerstedt, Matilda: Busse Nielsen, Anders; Maruthaveeran, Sreetheran; The International Federation of Parks and Recreation Administration, 2013)
Land-use decisions affect local and regional climate patterns by the Urban Cool Island Effect. (Kumar, Rahul; Mishra, Vimal; Indian Institute of Technology Gandhinagar; Buzan, Jonathan; Huber, Matthew; Purdue University; Kumar, Rohini; UFZ-Helmholtz Centre for Environmental Research; Shindell, Drew; Duke University, 2017)
Women living in homes surrounded by higher levels of greenery within a 250-meter radius had a 12% lower mortality rate. (James, Peter; Hart, Jaime; Banay, Rachel; Laden, Francine, 2016)
U.S. life expectancy is in decline for the first time since 1993. 3 of top 4 culprits: heart disease, diabetes, and Alzheimer’s, and all of which, as the other studies listed here show, are impacted by the forms of our built environment, and how well we integrate nature into cities. (Xu, Jiaquan; Murphy, Sherry; Kochanek, Kenneth; Arias, Elizabeth; U.S. National Center for Health Statistics; NCHS Data Brief No. 267, 2016)
More than 50% of people now live in urban areas. By 2050 this proportion will be 70%. Participants who went on a 90-min walk through a natural environment reported lower levels of rumination and showed reduced neural activity in an area of the brain linked to risk for mental illness compared with those who walked through an urban environment. These results suggest that accessible natural areas may be vital for mental health in our rapidly urbanizing world. (Bratmana, Gregory; Hamiltonb, Paul; Hahnc, Kevin; Daily, Gretchen; Grossc, James, 2015)
Epigenetics intones that even though you’re dealt your hand of DNA, your behavior has the ability to turn the sound up or down on your genetic predispositions. This study goes as far as to say your zip code is a more accurate health forecast than your genetic code. (Project for Public Spaces, 2016)
You don’t have to be touching nature to be healed by it. Just looking out a window at a garden is proven to increase your recovery rate. This psychological and physical boost is a micro-restorative experience. This early study by Roger Ulrich set in motion a vast inquiry. (Ulrich, Roger; Science, 1984)
Building Health: Urban Form
Social determinants of health include quality education, stable employment, safe homes and neighborhoods, and access to preventive services. Poor health outcomes are often made worse by the interaction between individuals and their social and physical environment. The targets for weight loss set in this framework of the U.S. Department of Health and Human Services are not currently being met by the population. (Office of Disease Prevention and Health Promotion, 2017)
U.S. metros with the highest levels of walkable urbanism are also the most educated and wealthy (as measured by GDP per capita) and, surprisingly, the most socially equitable. There are substantial and growing rental rate premiums for walkable urban office (90 percent), retail (71 percent), and rental multi-family (66 percent) over drivable sub-urban products. Combined, these three product types have a 74 percent rental premium over drivable sub-urban. The national concern about social equity has been exacerbated by the very rent premiums highlighted above, referred to as gentrification. Counter-intuitively, measurement of moderate-income household (80 percent of AMI) spending on housing and transportation, as well as access to employment, shows that the most walkable urban metros are also the most socially equitable. The reason for this is that low cost transportation costs and better access to employment offset the higher costs of housing. This finding underscores for the need for continued, and aggressive, development of attainable housing solutions. (Smart Growth America, 2016)
In under a decade, over 112,000 people were killed in speeding-related crashes in the U.S. For all causes of traffic fatalities, in 2016 alone over 37,000 people died in car crashes in the U.S. This is despite the effectiveness of engineering countermeasures for speeding is well established, including roundabouts and road diets. Information about them is available in several sources, including the AASHTO Highway Safety Manual (AASHTO 2010) and the FHWA’s online Crash Modification Factors Clearinghouse. Engineering countermeasures for speeding are also promoted in the National Association of City Transportation Planners’ Urban Street Design Guide (NACTO 2017) and are increasingly being adopted by state and local transportation departments. (National Transportation Safety Board; NTSB/SS-17/01 PB2017-102341, 2017)
Physical activity has many benefits, including reducing the risk of developing chronic diseases and supporting healthy aging. Walking is the most common form of physical activity across the country and an excellent way to help people become more active. In September 2015, the Office of the Surgeon General of the US Department of Health and Human Services released Step It Up! The Surgeon General’s Call to Action to Promote Walking and Walkable Communities to increase walking among people across the United States. Despite these benefits and the call to action, 49.9% of all US adults and 27.1% of high school students meet the recommendation for aerobic physical activity. (Centers for Disease Control and Prevention; US Dept of Health and Human Services, 2017)
Across Utah, a less than active person annually spends $3 less on healthcare for every additional mile walked and $0.75 for every additional mile biked. (Utah Transit Authority; Urban Design 4 Health, Inc.; Fehr and Peers; HDR Engineers, 2017)
Building Supply: Market Preference
Fewer young people want cars. In 1995, people age 21 to 30 drove 21% of all miles driven in the U.S.; in 2009 it was 14%, despite consistent growth of the age group. Living car-free in walkable areas fits younger lifestyles, as does owning less stuff, enabled by the sharing economy. (Advertising Age, 2010)
The number of people of all ages who have driver’s license decreased between 2011 and 2014 in the U.S. The group from 16 to 44 years old has been on the wane since 1983. The number is especially big for teens: in 1983, 46% of 16-year-olds had licenses, but in 2014 only 24% did. (Sivak, Michael; Schoettle, Brandon; Transportation Research Institute; The University of Michigan, 2016)
Gen Z (or iGen) in the U.S. are less likely to want to drive. (Twenge, JM; Park, H; San Diego State University and Bryn Mawr College; Child Development, 2017)
WORKS CITED
Abarca-Gomez, Leandra et al; World Health Organization; The Imperial College in London. (2017) Worldwide trends in body-mass index, underweight, overweight, and obesity from 1975 to 2016: a pooled analysis of 2416 population-based measurement studies in 128 million children, adolescents, and adults. Retrieved 2017 from http://www.thelancet.com/journals/lancet/article/PIIS0140-6736(17)32129-3/fulltext
Advertising Age. (2010) Is Digital Revolution Driving Decline in U.S. Car Culture?. Retrieved 2017 from http://adage.com/article/digital/digital-revolution-driving-decline-u-s-car-culture/144155/
American Farmland Trust. (2017) American Farmland Trust: Farmland Focus. Retrieved 2017 from https://www.farmland.org/our-work/areas-of-focus/farmland
American Planning Association. (2014) Investing in Place for Economic Growth and Competitiveness. Retrieved 2017 from https://www.planning.org/policy/polls/investing/pdf/pollinvestingreport.pdf
American Public Transportation Association. (2013) The New Real Estate Mantra: Location Near Public Transportation. Retrieved 2017 from http://www.apta.com/resources/statistics/Documents/NewRealEstateMantra.pdf
Andersen, L et al; Archives of Internal Medicine, 160, 1621-28. (2000) All-cause mortality associated with physical activity during leisure time, work, sports, and cycling to work.. Retrieved 2017 from https://www.ncbi.nlm.nih.gov/pubmed/10847255
Bernhardt, Richard. (2013) Nashville Form-Based Code Analysis. Retrieved 2017 from http://www.cvilletomorrow.org/news/article/25049-nashville-planner-on-form-based-zoning/
Bernstein, Scott; Center for Neighborhood Technology. (2015) H+T Affordability Index. Retrieved 2017 from https://htaindex.cnt.org
Bratmana, Gregory; Hamiltonb, Paul; Hahnc, Kevin; Daily, Gretchen; Grossc, James; PNAS 2015 112 (28) 8567-8572. (2015) Nature experience reduces rumination and subgenual prefrontal cortex activation. Retrieved 2017 from http://www.pnas.org/content/112/28/8567.full.pdf
Brookings. (2010) The Next Real Estate Boom. Retrieved 2017 from https://www.brookings.edu/articles/the-next-real-estate-boom/
Center for Disease Control; RTI. (2009) Annual Medical Spending Attributable to Obesity: Payer- and Service-Specific Estimates. Retrieved 2017 from https://www.cdc.gov/media/pressrel/2009/r090727.htm
Centers for Disease Control and Prevention; US Dept of Health and Human Services. (2017) Status Report for Step It Up! The Surgeon General’s Call to Action to Promote Walking and Walkable Communities. Retrieved 2017 from https://www.cdc.gov/physicalactivity/walking/call-to-action/pdf/status-report.pdf
Chawla, Raj; Wannell, Ted; Statistics Canada. (2005) Spenders and Savers. Retrieved 2017 from http://www.statcan.gc.ca/pub/75-001-x/10305/7797-eng.pdf
City of Calgary. (2009) PlanIt Calgary. Retrieved 2017 from http://www.calgary.ca/Transportation/TP/Pages/Planning/Forecasting/2009-PlanIT-Scenario-Archives.aspx
City of Copenhagen. (2012) Copenhagen’s Bike Account. Retrieved 2017 from http://grist.org/list/one-mile-on-a-bike-is-a-42-economic-gain-to-society-one-mile-driving-is-a-20-loss/
City of London, Ontario. (2013) Building a Mixed-Use, Compact City. Retrieved 2017 from https://www.london.ca/business/Planning-Development/Official-Plan/Documents/RethinkLondon/4%20Building%20a%20MixedUse%20Compact%20City.pdf
Cortright, Joe; City Observatory. (2015) Surging City Center Job Growth. Retrieved 2017 from http://cityobservatory.org/city-center-jobs/
Cortright, Joe; Impresa, Inc.; CEOs for Cities. (2009) Walking the Walk: How Walkability Raises Home Values in U.S. Cities. Retrieved 2017 from http://blog.walkscore.com/wp-content/uploads/2009/08/WalkingTheWalk_CEOsforCities.pdf
Dan Burden. (2006) Urban Street Trees: 22 Benefits. Retrieved 2017 from http://www.walkable.org/download/22_benefits.pdf
Doherty, Patrick; Leinberger; Christopher; Brookings. (2010) The Next Real Estate Boom. Retrieved 2017 from https://www.brookings.edu/articles/the-next-real-estate-boom/
Doug Farr. (2007) Sustainable Urbanism. Retrieved 2017 from http://farrside.com/book/
Erickson, Kirk et al; University of Pittsburgh. (2011) Exercise training increases size of hippocampus and improves memory. Retrieved 2017 from http://www.pnas.org/content/108/7/3017.abstract
Forbes. (2012) Pedaling to Prosperity. Retrieved 2017 from http://www.forbes.com/sites/tanyamohn/2012/05/20/bicyclists-in-the-united-states-save-at-least-4-6-billion-a-year-by-riding-instead-of-driving-ased-on-friday-to-coincide-with-national-bike-to-work-day-part-of-national-bike-month-which-occurs-each/
Ford, Jonathan; Morris Beacon. (2010) Smart Growth & Conventional Suburban Development An infrastructure case study completed for the EPA. Retrieved 2017 from https://www.epa.gov/sites/production/files/2014-07/documents/mbd-epa-infrastructure.pdf
Frank, Lawrence; British Columbia School of Planning. (2007) Promoting Physical Activity Through Healthy Community Design. Retrieved 2017 from http://health-design.spph.ubc.ca/research/previous-research/
Gibbs, Bob. (2011) Principles of Urban Retail Planning and Development. Retrieved 2017 from http://ca.wiley.com/WileyCDA/WileyTitle/productCd-0470488220.html
Gibbs, Bob. (2011) Principles of Urban Retail Planning and Development. Retrieved 2017 from http://ca.wiley.com/WileyCDA/WileyTitle/productCd-0470488220.html
Halifax Regional Municipality, Nova Scotia. (2005) Settlement Pattern and Form with Service Cost Analysis. Retrieved 2017 from http://usa.streetsblog.org/wp-content/uploads/sites/5/2015/03/Halifax-data.pdf
Harvard University. (2012) Harvard University Women’s Health Study. Retrieved 2017 from https://www.hsph.harvard.edu/nutritionsource/2016/08/16/nurses-health-study-40-year-anniversary-ajph/
Hay, Simon et al; The Lancet, Volume 390, Issue 10100, 1260 – 1344. (2017) Global, regional, and national disability-adjusted life-years (DALYs) for 333 diseases and injuries and healthy life expectancy (HALE) for 195 countries and territories, 1990-2016: a systematic analysis for the Global Burden of Disease Study 2016. Retrieved 2017 from http://www.thelancet.com/journals/lancet/article/PIIS0140-6736(17)32130-X/fulltext
James, Peter; Hart, Jaime; Banay, Rachel; Laden, Francine; Environ Health Perspect 124:1344-1352. (2016) Exposure to Greenness and Mortality in a Nationwide Prospective Cohort Study of Women. Retrieved 2017 from https://ehp.niehs.nih.gov/15-10363/
Knight Foundation & Gallup. (2011) Soul of the Community. Retrieved 2017 from https://knightfoundation.org/sotc/
Kokkinos, Peter. (2012) Physical Activity, Health Benefits, and Mortality Risk. Retrieved 2017 from https://www.ncbi.nlm.nih.gov/pmc/articles/PMC3501820/
Konijnendijk, Cecil; Annerstedt, Matilda: Busse Nielsen, Anders; Maruthaveeran, Sreetheran; The International Federation of Parks and Recreation Administration. (2013) Benefits of urban parks: a systematic review. A report for IPFRA. Retrieved 2017 from http://citeseerx.ist.psu.edu/viewdoc/download?doi=10.1.1.395.927&rep=rep1&type=pdf
Kumar, Rahul; Mishra, Vimal; Indian Institute of Technology Gandhinagar; Buzan, Jonathan; Huber, Matthew; Purdue University; Kumar, Rohini; UFZ-Helmholtz Centre for Environmental Research; Shindell, Drew; Duke University. (2017) Dominant control of agriculture and irrigation on urban heat island in India. Retrieved 2017 from https://www.nature.com/articles/s41598-017-14213-2
Leinberger, Chris; Alfonzo, Mariela; Brookings. (2012) Walk this Way. Retrieved 2017 from https://www.brookings.edu/wp-content/uploads/2016/06/25-walkable-places-leinberger.pdf
Lopez, Russ; Boston University School of Public Health. (2003) Urban Sprawl and Risk for Being Overweight or Obese. Retrieved 2017 from http://ajph.aphapublications.org/doi/abs/10.2105/AJPH.94.9.1574
Matthews, CE; Jurj, AL; Shu, XO; Li, HL; Yang, G; Li, Q; Gao, YT; Zheng, W; American Journal of Epidemiology, 165, 1343-50. (2007) Influence of exercise, walking, cycling, and overall nonexercise physical activity on mortality in Chinese women. Retrieved 2017 from https://www.ncbi.nlm.nih.gov/pubmed/17478434
Minicozzi, Joe; Urban3. (2010) Best bet for tax revenue: mixed-use downtown development. Retrieved 2017 from https://www.cnu.org/publicsquare/2010/09/13/best-bet-tax-revenue-mixed-use-downtown-development
Mr. Money Mustache. (2011) The True Cost of Commuting. Retrieved 2017 from http://www.mrmoneymustache.com/2011/10/06/the-true-cost-of-commuting/
National Association of Realtors. (2015) NAR 2015 Community Preference Survey. Retrieved 2017 from http://www.realtor.org/sites/default/files/reports/2015/nar-psu-2015-poll-press-release.pdf
National Transportation Safety Board; NTSB/SS-17/01 PB2017-102341. (2017) Reducing Speeding-Related Crashes Involving Passenger Vehicles. Retrieved 2017 from https://www.ntsb.gov/safety/safety-studies/Documents/SS1701.pdf
New York City. (2016) Inventory of New York City Greenhouse Gas Emissions. Retrieved 2017 from https://www1.nyc.gov/assets/sustainability/downloads/pdf/publications/NYC_GHG_Inventory_2014.pdf
Nicholls, S.; Crompton, J. L.; National Recreation and Parks Association; Journal of Leisure Research. (2005) The Impact of Greenways on Property Values: Evidence from Austin, Texas. Retrieved 2017 from http://www.nrpa.org/globalassets/journals/jlr/2005/volume-37/jlr-volume-37-number-3-pp-321-341.pdf
Office of Disease Prevention and Health Promotion. (2017) Healthy People 2020. Retrieved 2017 from https://www.healthypeople.gov/2020/data-search/midcourse-review/lhi
Ostergaard, AG et al; Journal of Physical Activity and Health, Volume 9. (2012) Cycle to school is associated with lower BMI and lower odds of being overweight or obese in a large population-based study of Danish adolescents. Retrieved 2017 from https://www.ncbi.nlm.nih.gov/pubmed/22733866
Pivo, Gary; Fisher, Jeffrey; University of Arizona; Indiana University. (2010) The Walkability Premium in Commercial Real Estate Investments. Retrieved 2017 from http://www.u.arizona.edu/~gpivo/Walkability%20Paper%208_4%20draft.pdf
Project for Public Spaces. (2016) The Case for Healthy Places: Improving Health Outcomes Through Placemaking. Retrieved 2017 from https://www.pps.org/wp-content/uploads/2016/12/Healthy-Places-PPS.pdf
Purdue University. (2017) People for Bikes: Health Statistics. Retrieved 2017 from http://peopleforbikes.org/our-work/statistics/
Putnam, Robert. (2000) Bowling Alone. Retrieved 2017 from http://bowlingalone.com/
Redfin. (2016) How Much is a Point of Walk Score Worth? Retrieved 2017 from https://www.redfin.com/blog/2016/08/how-much-is-a-point-of-walk-score-worth.html
Rogers, Shannon; Halstead, John; Gardner, Kevin; Carlson, Cynthia; University of New Hampshire. (2010) Examining Walkability and Social Capital as Indicators of Quality of Life at the Municipal and Neighborhood Scales. Retrieved 2017 from https://link.springer.com/article/10.1007/s11482-010-9132-4
Shaheen, Susan. (2014) Transportation Sustainability Research Cente. Retrieved 2017 from https://www.scientificamerican.com/article/is-bike-sharing-really-climate-friendly/
Sivak, Michael; Schoettle, Brandon; Transportation Research Institute; The University of Michigan. (2016) Recent Decreases in the Proportion of Persons with a Driver’s License across All Age Groups. Retrieved 2017 from http://www.umich.edu/~umtriswt/PDF/UMTRI-2016-4_Abstract_English.pdf
Smart Growth America; Cushman & Wakefield; George Washington University School of Business’ Center for Real Estate and Urban Analysis. (2015) Core Values: Why American Companies are Moving Downtown. Retrieved 2017 from https://smartgrowthamerica.org/resources/core-values-why-american-companies-are-moving-downtown/
Smart Growth America. (2013) Building Better Budgets. Retrieved 2017 from https://smartgrowthamerica.org/resources/building-better-budgets-a-national-examination-of-the-fiscal-benefits-of-smart-growth-development/
Smart Growth America. (2016) Foot Traffic Ahead. Retrieved 2017 from https://smartgrowthamerica.org/resources/foot-traffic-ahead-2016/
Smart Prosperity Institute. (2013) Suburban Sprawl: Exposing Hidden Costs, Identifying Innovations. Retrieved 2017 from http://thecostofsprawl.com
Smart Prosperity Institute. (2013) Suburban Sprawl: Exposing Hidden Costs, Identifying Innovations. Retrieved 2017 from http://thecostofsprawl.com
The Alliance for Biking & Walking. (2016) Bicycling & Walking in the United States 2016 Report. Retrieved 2017 from https://www.aarp.org/content/dam/aarp/livable-communities/documents-2016/2016-WalkingBicyclingBenchmarkingReport.pdf
The Transportation Research Board; National Academy of Sciences, Engineering, and Medicine. (2010) Driving and the Built Environment. Retrieved 2017 from http://www.trb.org/Publications/Blurbs/Driving_and_the_Built_Environment_The_Effects_of_C_162093.aspx
Twenge, JM; Park, H; San Diego State University and Bryn Mawr College; Child Development. (2017) The Decline in Adult Activities Among U.S. Adolescents, 1976-2016. Retrieved 2017 from http://onlinelibrary.wiley.com/doi/10.1111/cdev.12930/full
Ulrich, Roger; Science. (1984) View through a window may influence recovery from surgery. Retrieved 2017 from http://science.sciencemag.org/content/224/4647/420
Utah Transit Authority; Urban Design 4 Health, Inc.; Fehr and Peers; HDR Engineers. (2017) Economic Impacts of Active Transportation: Utah Active Transportation Benefits Study. Retrieved 2017 from https://bikeutah.org/wp-content/uploads/2017/03/Utah-Active-Transportation-Benefits-Study-Final-Report.pdf
Willis, D., Manaugh; K., El-Geneidy, A. (2013) Uniquely Satisfied: Exploring Cyclists Trip Satisfaction. Retrieved 2017 from http://tram.mcgill.ca/Research/Publications/Cycling_Satisfaction_TRB.pdf
Xu, Jiaquan; Murphy, Sherry; Kochanek, Kenneth; Arias, Elizabeth; U.S. National Center for Health Statistics; NCHS Data Brief No. 267. (2016) Mortality in the United States, 2015. Retrieved 2017 from https://www.cdc.gov/nchs/products/databriefs/db267.htm
Additions and corrections welcome in the comments below.
–Hazel Borys
If PlaceShakers is our soapbox, our Facebook page is where we step down, grab a drink and enjoy a little conversation. Looking for a heads-up on the latest community-building news and perspective from around the web? Click through and “Like” us and we’ll keep you in the loop.
